 Getly
GetlyAnalytics & Reporting Tools
Weekly KPI Report Generator - Excel & Google Sheets | Sales Dashboard
Turn weekly sales CSV or Excel exports into a clean KPI report with revenue, refunds, orders, AOV, daily trends, top products, customer metrics, anomaly flags, review queues, and an executive dashboard.
Product Description
Turn recurring sales exports into a decision-ready weekly KPI report without building a dashboard from scratch.
Weekly KPI Report Generator is a local reporting toolkit for freelancers, operators, agencies, creators, and small businesses that need a repeatable way to turn CSV or Excel sales data into a structured weekly business report.
The workflow is designed for operational reporting: load your sales data, validate the structure, choose the reporting period, generate the report, and review any records that require attention.
WHAT YOU GET
Local Python report generator
Windows launcher
macOS/Linux launcher
Excel dashboard template
Sample sales dataset
Example completed dashboard
CSV and XLSX input examples
Review and anomaly outputs
Weekly report summary
Security guide
13-page user manual
Configuration examples
Test suite
README
START HERE guide
SOURCES
CHANGELOG
Commercial license
KEY METRICS
The generated report can include:
Gross revenue
Refunds
Net revenue
Order count
Average order value
Paid orders
Pending orders
Refunded orders
Customer count
Unique customers
Repeat-customer metrics
Daily revenue trend
Daily order trend
Top products
Top customers
Status breakdown
Review queue
Data-quality flags
WHAT THE REPORT GENERATES
The reporting workflow produces structured outputs such as:
Weekly KPI summary
Daily trend table
Product performance table
Customer performance table
Status summary
Review queue
Anomaly flags
JSON audit summary
Excel-ready tables
Google Sheets-ready data
CURRENCY SAFETY
Different currencies are never silently combined into one revenue total.
When multiple currencies are present, the report keeps the currency streams separate and prevents invalid cross-currency aggregation.
DATA VALIDATION
The generator validates the input before calculating KPIs.
Examples of records that can require review include:
Missing dates
Ambiguous dates
Invalid amounts
Missing currency
Conflicting amount columns
Duplicate order IDs
Unknown statuses
Invalid or unexpected data structures
FINANCIAL PRECISION
Monetary calculations use decimal arithmetic to avoid common binary floating-point rounding problems.
This is especially important for totals, refunds, net revenue, and average order value.
HOW IT WORKS
Prepare a CSV or Excel sales export.
Load the file into the reporting workflow.
Select or configure the required columns.
Choose the reporting period.
Run validation.
Generate the weekly report.
Review flagged records.
Open the generated Excel dashboard or import the prepared tables into Google Sheets.
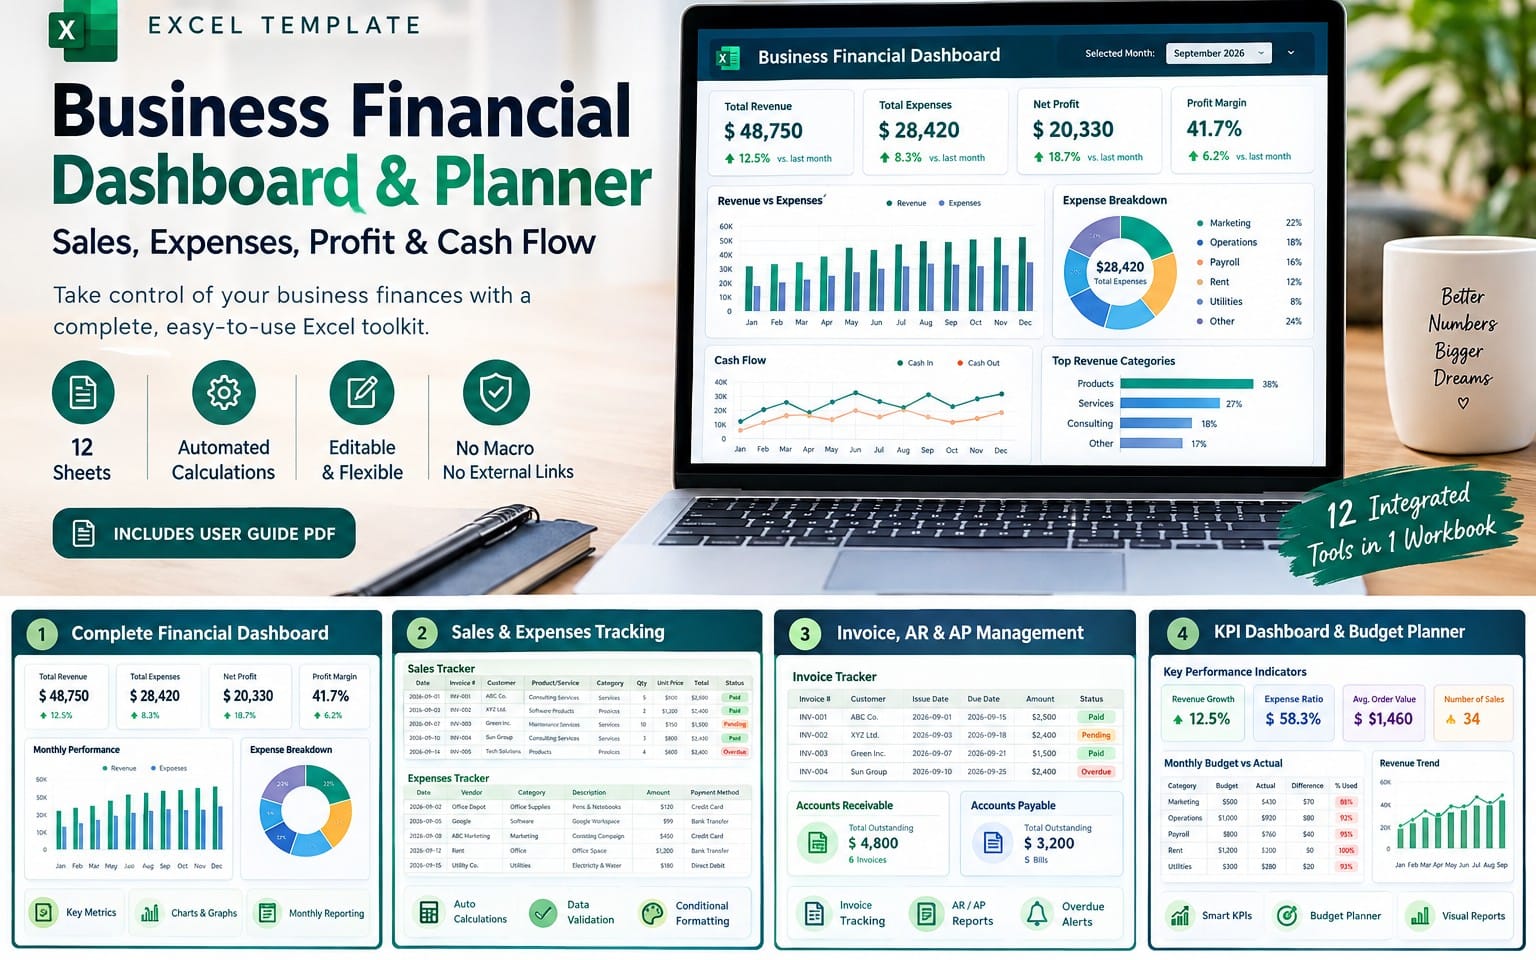
EXCEL DASHBOARD
The included workbook template is designed for operational reporting and includes:
KPI overview
Revenue summary
Orders summary
AOV
Daily trend
Product performance
Customer performance
Status summary
Data-quality indicators
GOOGLE SHEETS
The generated tabular outputs are designed to be easy to import into Google Sheets.
The product does not require the Google Sheets API for the core reporting workflow.
PRIVACY
The core reporting workflow is local.
Your sales data is processed on your own computer and is not uploaded to an external reporting service by the generator.
IMPORTANT
This product does not provide accounting, tax, audit, or financial advice.
It is a reporting and analytics tool.
Always validate reports against your source system before using them for financial decisions, accounting records, tax filing, or external reporting.
REQUIREMENTS
Python 3.11 or newer
Windows, macOS, or Linux
CSV or Excel sales data in a supported structure
No paid API is required for the core reporting workflow.
LIMITATIONS
The generator is deterministic and column-driven.
It does not use an AI model to guess missing financial values.
Ambiguous or invalid records are flagged for human review instead of being silently guessed.
LICENSE
Commercial use is allowed for the purchaser's own business and client projects.
The templates and scripts may be modified for internal workflows.
Resale, sublicensing, redistribution, or repackaging of the original files as a competing product is prohibited.
DELIVERY
You receive one complete downloadable ZIP containing the reporting tool, Excel template, examples, documentation, security materials, and supporting files.
REFUNDS
Please review the supported input structure, requirements, limitations, and included files before purchasing.
Getly's current platform refund policy applies to the listing.
What you get
1 file · 61.91 KB
- SOFLMARKET_Weekly_KPI_Report_Generator.zipZIP · 61.91 KB
Analytics & Reporting Tools
Weekly KPI Report Generator - Excel & Google Sheets | Sales Dashboard
Turn weekly sales CSV or Excel exports into a clean KPI report with revenue, refunds, orders, AOV, daily trends, top products, customer metrics, anomaly flags, review queues, and an executive dashboard.
Tags
Frequently asked questions
Do I get access instantly?
Yes. This is a digital product - you can download it right after checkout, straight from your library.
Can I use it for commercial projects?
Yes. Commercial and client work are both allowed, including products with unlimited sales. You may not resell the file itself.
What's your refund policy?
You're covered by a 30-day money-back guarantee. If something isn't right, request a refund from your order and the Getly team reviews it.
What file formats and sizes will I get?
You'll download 1 file - ZIP - 61.91 KB in total.
Do I get free updates?
Yes - when the seller ships a new version, you can re-download the latest files from your library at no extra cost. Check the changelog for recent updates.
Price
$12.99