 Getly
Getly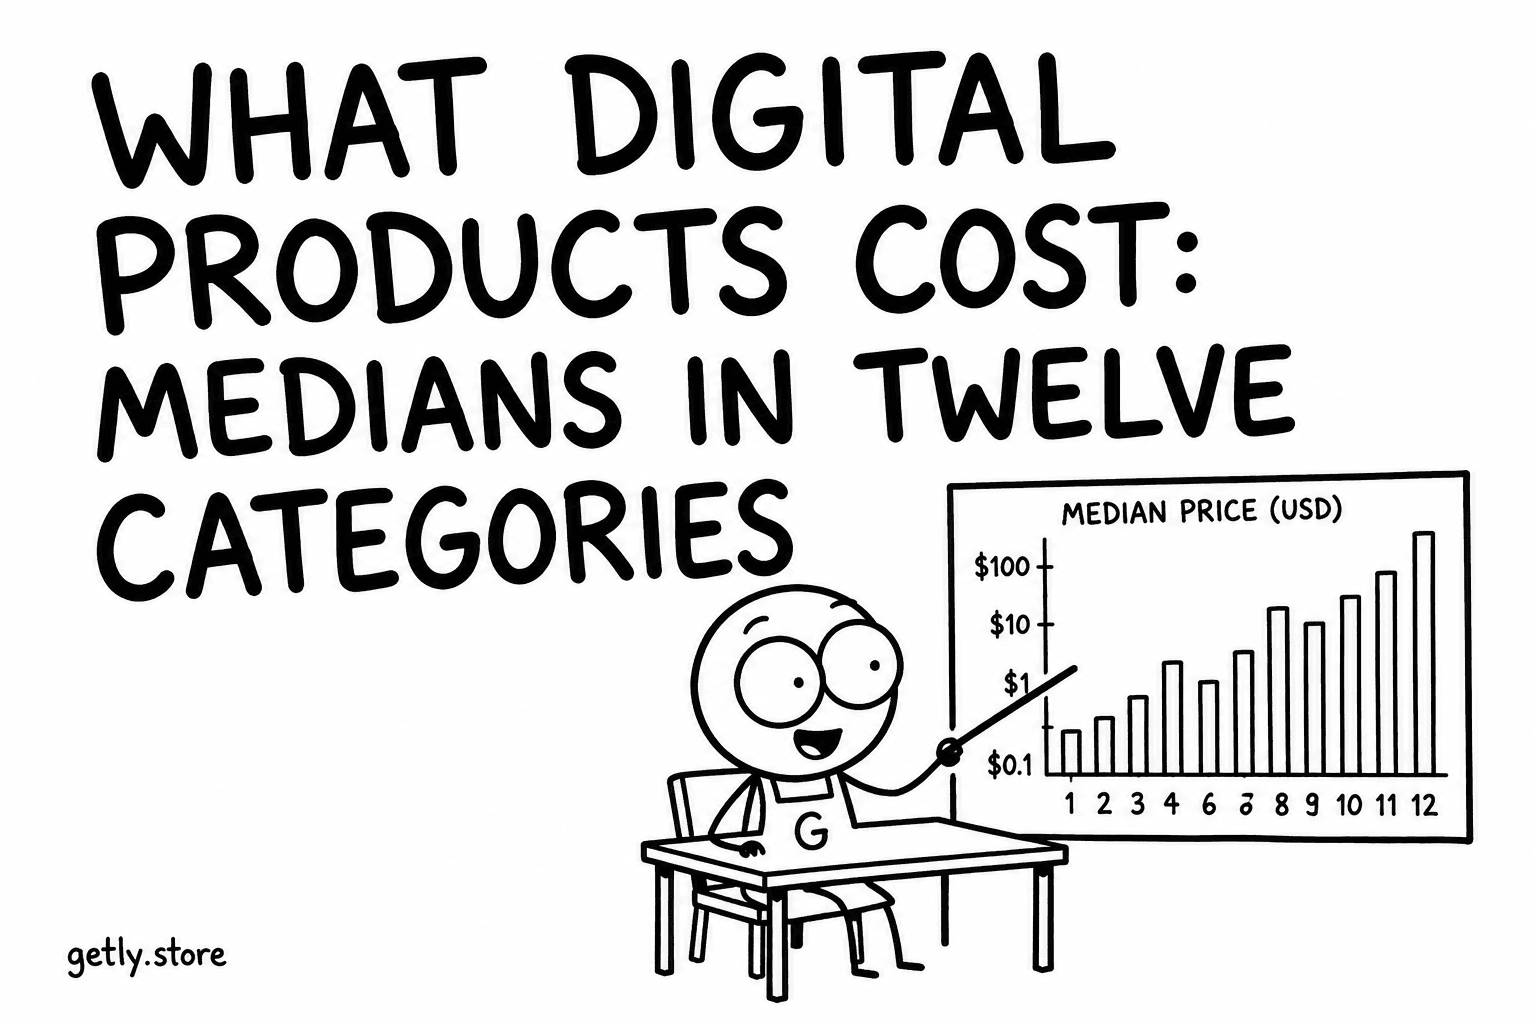
Pricing advice for digital products is usually someone's opinion. This is a measurement: the asking price of every active paid listing in the catalogue on 5 September 2026 - 4,885 products. Asking prices, not what was paid; this is a description of the shelf, not of the till.
The whole catalogue
Across everything with a price above zero, the middle is low and the tail is long:
- 10th percentile $1.99 · 25th $3.00 · median $6.99 · 75th $15.00 · 90th $47.00.
- 2.0% of listings are free. 8.5% are pay-what-you-want with a floor.
- 31.2% show a crossed-out "compare at" price above the asking price.
Half of everything for sale costs seven dollars or less. One in ten costs forty-seven or more. There is no cluster around the $19–29 range that pricing guides love; the catalogue is a slope from two dollars down to fifty, and most sellers are standing near the bottom of it.
By category - median, with the middle half
The twelve largest parent categories by number of listings. The range is the 25th to 75th percentile, i.e. where the middle half of sellers price.
- E-books & Written Content (1,010 paid listings) - median $9.49, middle half $4.50–$19.
- Graphics & Design (841) - $4.00, $1.99–$10.
- Lifestyle & Personal (547) - $3.99, $1.99–$6.99.
- Software & Apps (406) - $12.00, $4.12–$49.
- Themes & Templates (402) - $8.00, $3.13–$15.
- Education & Courses (340) - $6.99, $3–$15.
- AI & Data (279) - $8.50, $3.99–$19.
- Business & Finance (174) - $13.50, $7.99–$24.74.
- Photography (171) - $4.00, $4–$8.50.
- 3D & AR/VR (158) - $4.00, $4–$9.99.
- Gaming & Entertainment (87) - $10.00, $4.99–$24.50.
- Audio & Music (86) - $9.99, $5–$19.99.
Two readings. Business & Finance and Software price highest, and their middle half starts where Graphics' middle half ends - a buyer of a spreadsheet model expects to pay for it in a way a buyer of a background does not. Photography and 3D both sit at a flat four dollars with a narrow band, which is a sign of a few prolific sellers pricing a large catalogue identically rather than of a market finding a level.
The crossed-out price
Nearly a third of listings display a higher "was" price. Some of these are real promotions with an end date. Many are permanent: the product has never been sold at the crossed-out figure and never will be. Buyers are not new to this device, and the platform's rule is simple - a compare-at price is shown as the seller entered it, and a seller who lists a $9 template as "was $199" is making a claim they may be asked to support. If you use it, use it for a real sale, and take it down when the sale ends.
What to do with this
Not "price at the median." The median is where the crowd is, and the crowd, by definition, is not where a product stands out. Use the table for the opposite purpose: find the band for your category, then decide deliberately whether you are pricing inside it, and if outside, why a buyer would agree. A $29 icon set in a category whose middle half stops at $10 needs to be visibly a different kind of icon set - more of them, better licensed, better documented. A $2.99 course in a category whose middle half starts at $3 is telling the buyer it is thin before they open it.
The one thing the numbers argue against is the reflex to price at $1.99 because it feels safe. Ten per cent of the catalogue is already there, and none of it is easier to find for being cheap.