 Getly
Getly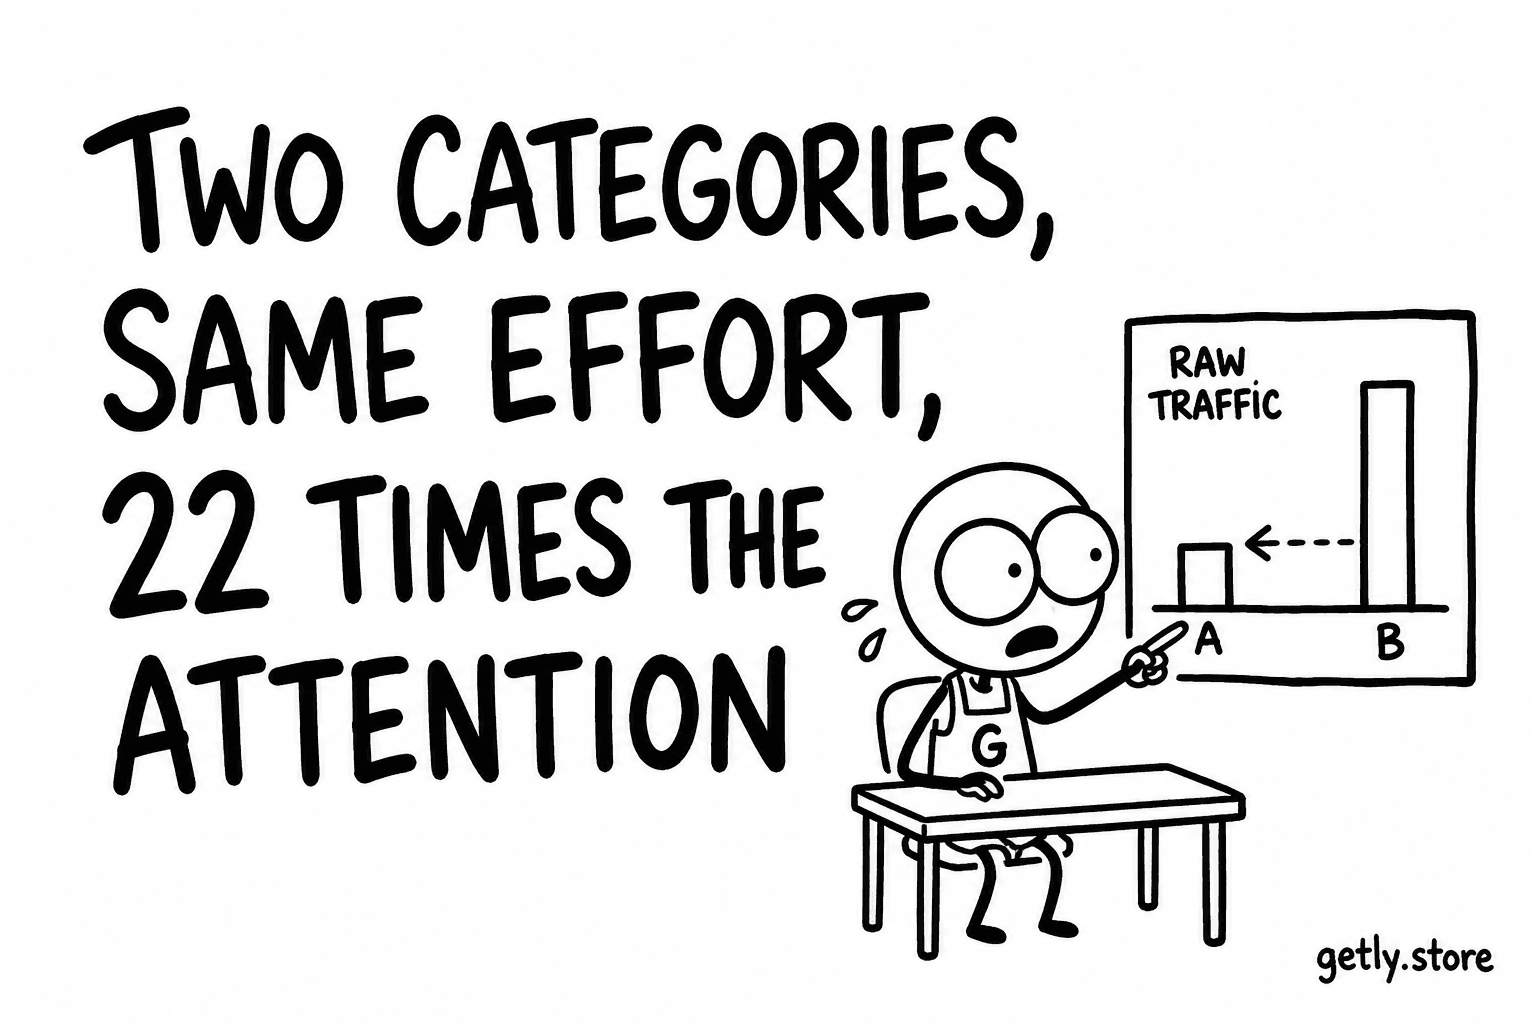
A seller finishing a product has one decision left that costs nothing and changes everything: which category to put it in. Almost everyone makes it on instinct — the category that describes the thing — and almost nobody checks how much attention that shelf actually gets.
Here is the number, measured over thirty days to 3 September 2026. Buyer views of product pages, divided by the count of active products competing for them:
- Poster templates — 83 views per listing.
- Photography templates — 65.
- Finance and accounting courses — 64.
- After Effects templates — 61.
- AI tools and scripts — 44.
- Backgrounds and wallpapers — 19.
- Android app templates — 15.
- E-books — 3.7.
The trap is that the raw traffic says the opposite
Backgrounds and wallpapers is the single most-viewed category in the catalogue. If you ranked shelves by total buyer interest it would come first, and a seller reading that table would head straight for it.
They would be walking into the most crowded room in the building. All that traffic is split across an order of magnitude more products than the categories above it, and one more wallpaper joins a queue. Poster templates draw less traffic in total and roughly four times as much of it per listing.
E-books is the same trap in its final form: heavy total interest, and so many products sharing it that a new listing can expect the attention of about four page views. That is not a judgement about e-books. It is arithmetic about how many other people had the same idea.
Why nobody was checking
Because nothing showed them. The number exists — every product page view is recorded, every active product is counted — and it lived in a database rather than anywhere a seller would look. A decision worth a factor of twenty-two was being made blind.
That is now fixed in the two places it matters. There is a page that ranks the thin, high-traffic categories, and there is a line inside the product form itself: choose a category and it tells you what a listing there typically sees. The moment of choice is the only moment the number can change anything.
The list refuses to guess
A category needs real traffic before it appears as an opportunity — a floor of 200 views over thirty days, and at least 1.5 times the catalogue-wide average attention per listing. Below either line it is left off entirely.
That floor is doing more work than it looks. A category with 150 views and no products at all scores infinitely well on attention-per-listing and would top the ranking on a number computed from nothing. Publishing that as a recommendation would be worse than publishing nothing, because a seller would act on it. So the page will show an empty list rather than a padded one; a recommendation panel that always has eight rows teaches the reader that the rows mean nothing.
What this does not fix
Putting a product on a busier shelf does not make it good. Attention per listing tells you how many people will look; it says nothing about whether they will buy what they find. The conversion from a look to a purchase is a different problem, and it is mostly about whether a buyer can tell what they are getting before they pay.
But the category decision is free, reversible and made once. Being twenty-two times more visible for the same work is the cheapest thing available to a seller here, and until now the number to make that decision on was not on the screen.