 Getly
GetlyA Simple Small-Business Dashboard: What to Track Every Week
Small businesses often collect numbers in several places and only look at them when something goes wrong. A simpler system is to keep a small set of operational metrics together.
Track these five areas
1. Sales: date, product/service, quantity and revenue.
2. Expenses: amount, category and payment date.
3. Inventory: current quantity and low-stock items.
4. Profit: revenue minus operating expenses, with a clear monthly view.
5. KPIs: monthly sales, expenses, profit and margin trends.
The goal is not to build a complicated accounting platform. The goal is to make weekly decisions easier: what is selling, what is costing too much, and what needs restocking.
When an Excel dashboard makes sense
An editable workbook is useful when you want local files, no monthly subscription and the ability to change formulas or columns yourself. It can also be easier for a small team than maintaining several apps.
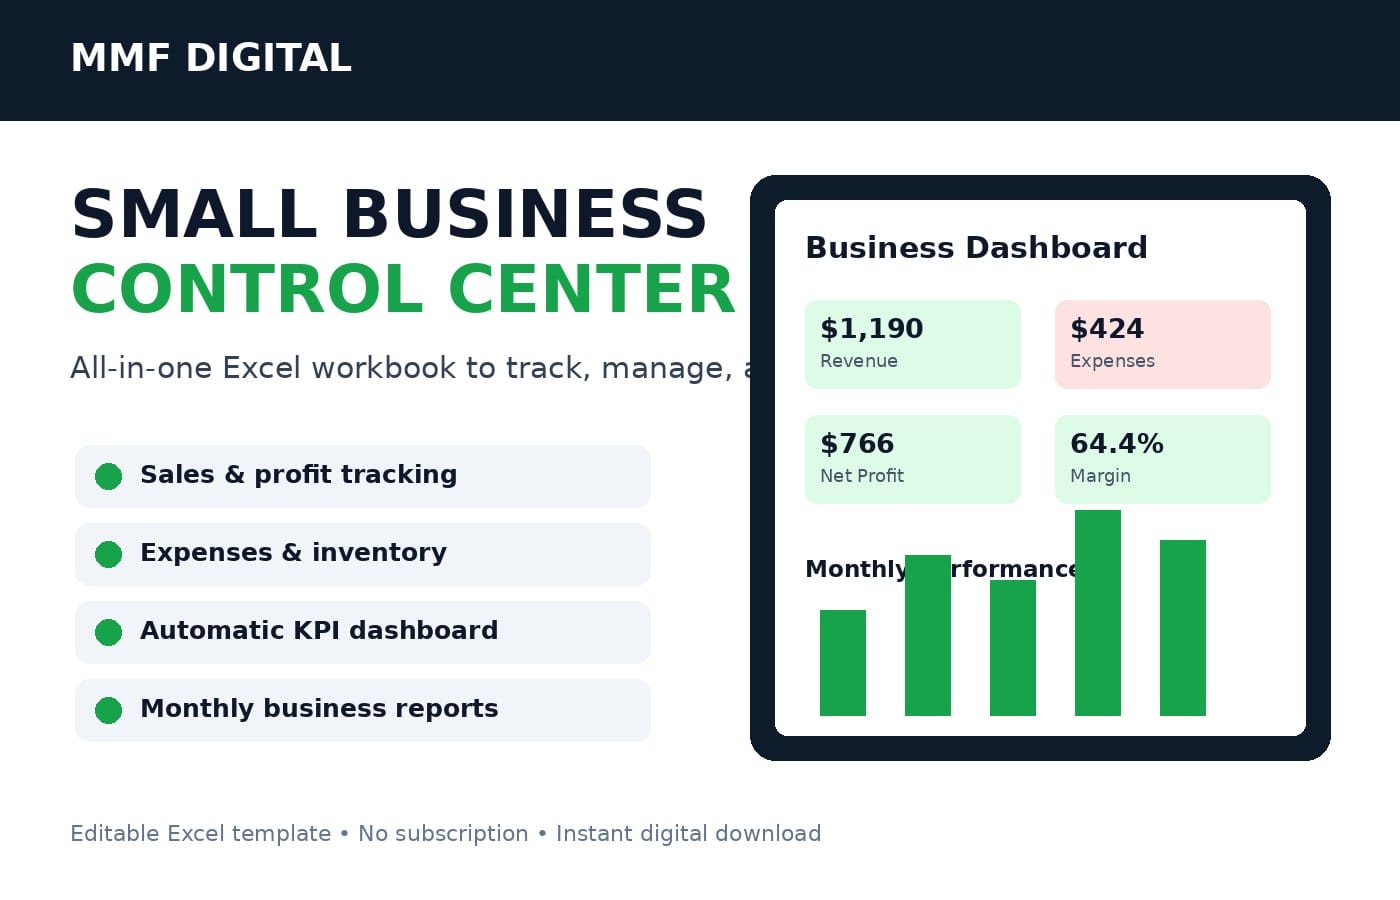
Small Business Excel Dashboard — Sales, Expenses & Inventory
$15.00
Use a professional accountant or tax adviser for statutory accounting and tax decisions; a dashboard is an operational tool, not professional financial advice.