 Getly
GetlyExcel Templates
SPC Engineering Toolkit – Professional Statistical Process Control Excel Dashboard
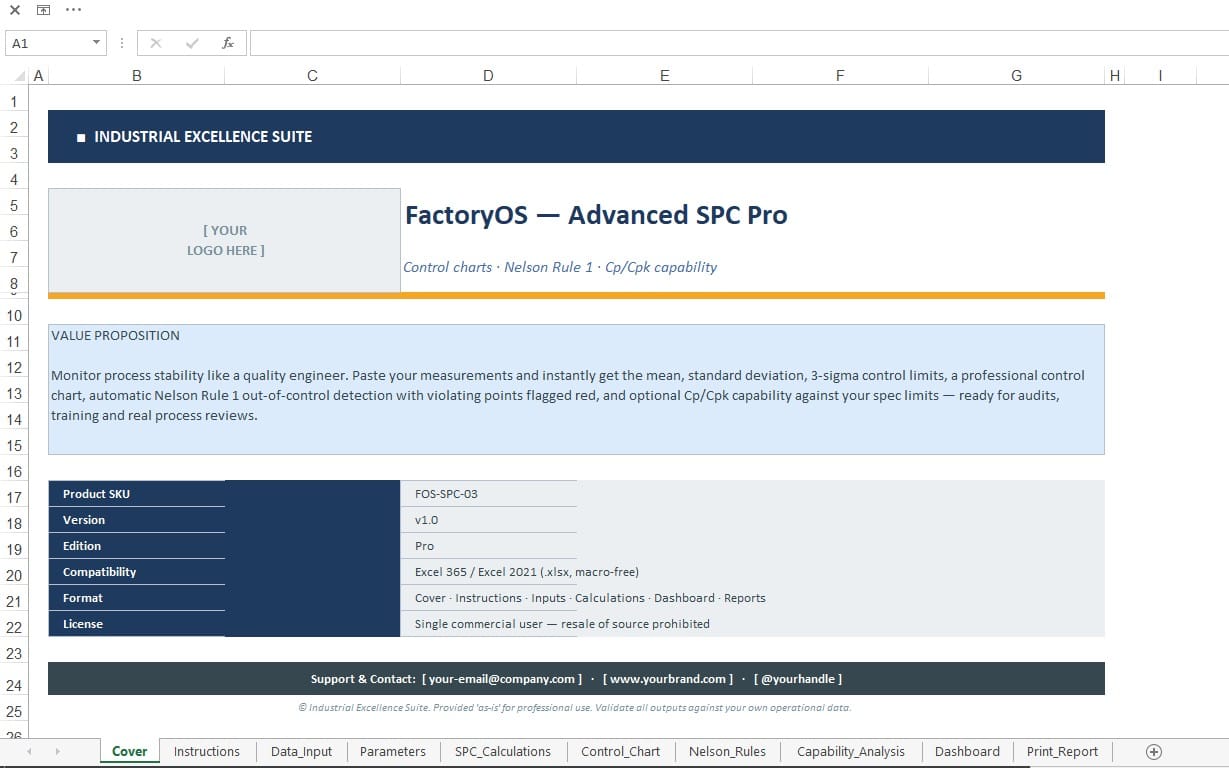
Professional, formula-driven SPC Excel toolkit for quality engineers and manufacturing professionals. Analyze variable and attribute data, generate control charts, detect special-cause variation, calculate Cp/Cpk and Pp/Ppk, perform Pareto defect analysis, and monitor process performance from a single automated dashboard.
Product description
SPC Engineering Toolkit – Professional Statistical Process Control Excel Dashboard
Turn raw manufacturing quality data into actionable process insights with a professional, formula-driven Statistical Process Control (SPC) Excel toolkit designed for quality engineers, process engineers, manufacturing engineers, and continuous improvement professionals.
This workbook provides a complete SPC analysis environment without requiring specialized statistical software. Enter or paste your process data and the calculations, control limits, charts, capability metrics, defect analysis, and dashboard automatically update.
What’s Included
Variable SPC Analysis
X-bar & R charts
X-bar & S charts
Individuals & Moving Range (I-MR) charts
Automatic center line, UCL, and LCL calculations
Standard SPC constants based on subgroup size
Clear distinction between control limits and specification limits
Attribute SPC Analysis
p charts
np charts
c charts
u charts
Support for varying sample sizes where applicable
Automatic control-limit calculations
Special-Cause Detection
Automatically identifies statistically significant process patterns, including:
Points outside control limits
Runs
Trends
Sustained shifts
Other special-cause patterns based on Nelson-style SPC rules
The workbook identifies the rule violation and provides a plain-language interpretation to help engineers investigate potential process conditions.
Process Capability
Calculate:
Cp
Cpk
Pp
Ppk
Sigma level
DPMO
Defect rate
The workbook distinguishes between short-term/within-subgroup variation and overall process variation, helping you understand both process capability and actual performance.
Defect & Pareto Analysis
Defect counts
Defect percentages
DPU
DPMO
Automatic Pareto ranking
Identification of highest-contributing defect categories
Professional Dashboard
A management-friendly dashboard provides a high-level view of:
Overall process status
Cpk and Ppk
Sigma level
DPMO
Defect rate
Out-of-control points
SPC rule violations
Specification compliance
Process trend
Major defect categories / Pareto analysis
Visual status indicators make it easy to distinguish between Stable, Warning, and Out of Control conditions.
Designed for Real Engineering Work
The workbook is built as an application rather than a static template. It includes:
Formula-driven calculations
Data validation
Input guidance
Automatic warnings
Error handling
Transparent and auditable formulas
Engineering-focused calculations
Ready-to-use charts
Automatic dashboard updates
You can paste new production data into the input sheets without manually rebuilding formulas or charts.
Typical Applications
Ideal for:
Manufacturing process monitoring
Quality control
Production engineering
Six Sigma projects
Continuous improvement
Process capability studies
Supplier quality analysis
Production line monitoring
Defect reduction projects
Root-cause investigation
Management reporting
Who Is This For?
This toolkit is suitable for:
Quality Engineers
Manufacturing Engineers
Process Engineers
Industrial Engineers
Quality Managers
Six Sigma Professionals
Continuous Improvement Engineers
Production Supervisors
Manufacturing Consultants
Engineering Students and Trainers
Included Sample Data
The workbook includes a realistic illustrative manufacturing dataset so you can immediately explore the calculations, charts, capability analysis, rule detection, and dashboard before entering your own data.
Software Requirement
Microsoft Excel with support for standard workbook formulas and charts is recommended.
This is an engineering analysis and reporting toolkit intended to support SPC activities. Users should validate results against their organization's quality procedures, applicable standards, and engineering requirements before making production or compliance decisions.
What you get
1 file · 314.82 KB
- SPC_Engineering_Toolkit.xlsxXLSX · 314.82 KB
Excel Templates
SPC Engineering Toolkit – Professional Statistical Process Control Excel Dashboard
Professional, formula-driven SPC Excel toolkit for quality engineers and manufacturing professionals. Analyze variable and attribute data, generate control charts, detect special-cause variation, calculate Cp/Cpk and Pp/Ppk, perform Pareto defect analysis, and monitor process performance from a single automated dashboard.
Included in Getly ProGet Pro
Tags
Frequently asked questions
Do I get access instantly?
Yes. This is a digital product - you can download it right after checkout, straight from your library.
Can I use it for commercial projects?
Yes. Commercial use is allowed: use it in your own business and in things you sell. You may not resell or redistribute the file itself.
What's your refund policy?
You can request a refund within 30 days. If something isn't right, request it from your order and the Getly team reviews it.
What file formats and sizes will I get?
You'll download 1 file - XLSX - 314.82 KB in total.
Do I get free updates?
Yes - when the seller ships a new version, you can re-download the latest files from your library at no extra cost. Check the changelog for recent updates.
Price
$2.99