 -27% OFF
Unity Assets & Plugins
Memory Profiler Companion
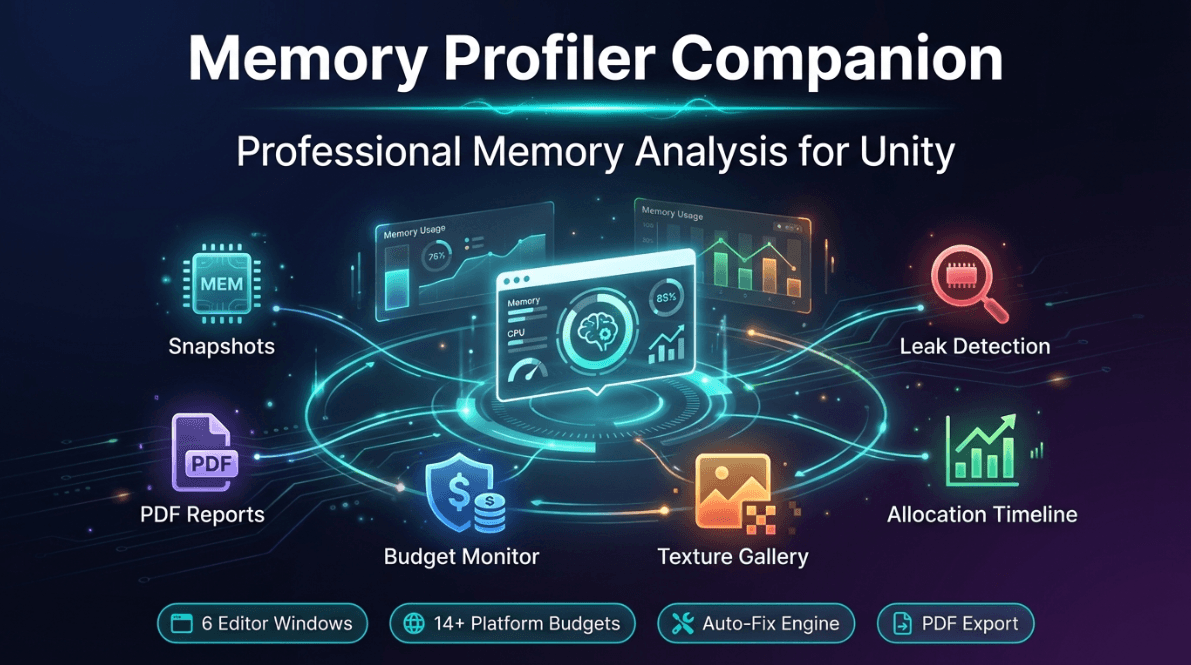
Advanced memory profiling, leak detection, and optimization toolkit. 6 Editor windows, real-time tracking, auto-fix, 14+leak types, platform budgets, PDF/HTML/CSV export. Zero dependencies.
Product Description
Memory Profiler Companion is a complete memory profiling and optimization toolkit for Unity. It goes beyond Unity's built-in profiler by providing actionable recommendations, automatic
leak detection, texture analysis, allocation tracking, and
platform-specific budget monitoring — all from dedicated Editor
windows.
6 EDITOR WINDOWS
Memory Dashboard — Central hub with real-time overview,
category breakdown, top assets, AI-powered recommendations, and snapshot history. Capture, compare, and export memory data in
one click.
Texture Gallery — Visual browser for all loaded textures.
Grid, list, and detail views. Filter by issues: uncompressed,
oversized, non-POT, readable, no mipmaps. Sort by size, name,
resolution, or format.
Leak Detective — Automatic memory leak scanner detecting 14+
leak types: static references, event subscriptions, delegates,
coroutines, duplicate assets, memory growth patterns.
Continuous monitoring mode for Play Mode.
Allocation Timeline — Real-time per-frame allocation chart
with zoom and scroll. Hot spot ranking shows the heaviest
allocators. GC event history with generation and freed memory
details.
Reference Explorer — Trace what keeps objects alive. View
full reference chains, identify root references and static
fields preventing garbage collection.
Budget Monitor — Platform-specific memory budgets (Mobile
Low/Mid/High, Switch, PS4, PS5). Category-by-category progress
bars, violation tracking, and cross-platform comparison.
KEY FEATURES
Auto-Fix Engine — one-click texture optimization (compress,
disable readable, enable mipmaps) with full Undo support
Smart Recommendations — priority-ranked suggestions with
estimated memory savings
Snapshot Comparison — diff any two snapshots to see exactly
what changed
GC Monitor — real-time GC pressure, prediction, and
allocation rate tracking
Custom Budgets — create and save your own platform budget
profiles
Export — HTML, CSV, JSON, Markdown, and PDF reports
Runtime API — use programmatically for automated profiling in
CI/CD pipelines
Interactive Demo Scene — learn the toolkit with intentionally
problematic assets
RUNTIME API
Full C# API for programmatic access: capture snapshots, track
allocations, detect leaks, analyze textures, monitor GC
pressure, and generate recommendations from code. Works in both
Editor and development builds.
ZERO DEPENDENCIES
Works out of the box. No external packages required. Supports
Unity 2021.3 LTS and later.
Unity Assets & Plugins
Memory Profiler Companion
Advanced memory profiling, leak detection, and optimization toolkit. 6 Editor windows, real-time tracking, auto-fix, 14+leak types, platform budgets, PDF/HTML/CSV export. Zero dependencies.
Tags
Frequently asked questions
Do I get access instantly?
Yes. This is a digital product — you can download it right after checkout, straight from your library.
Can I use it for commercial projects?
Your purchase includes a standard license for personal and commercial use. See the product description for any usage limits set by the seller.
What's your refund policy?
You're covered by a 30-day money-back guarantee. If something isn't right, request a refund from your order and the seller will review it.
What file formats and sizes will I get?
You'll download the files exactly as the seller packaged them (about 1.42 MB). See the product details and description for the included formats.
Do I get free updates?
Yes — when the seller ships a new version, you can re-download the latest files from your library at no extra cost. Check the changelog for recent updates.
Price
$21.99