 -27% СКИДКА
Ассеты и плагины Unity
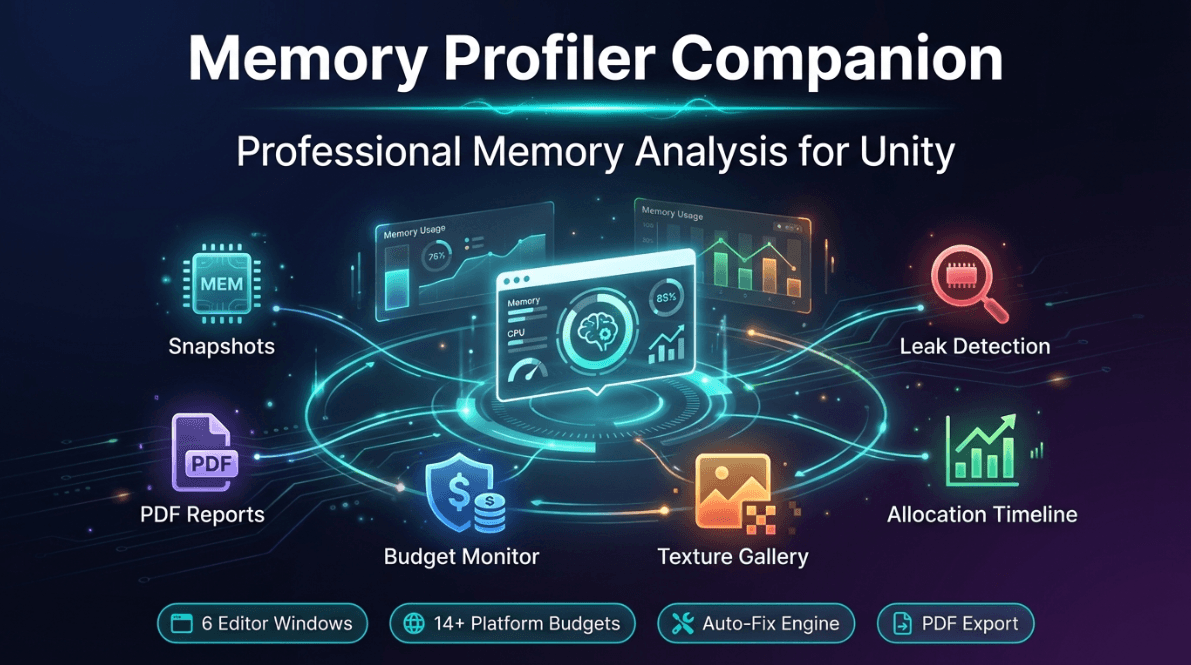
Memory Profiler Companion
Расширенный набор инструментов для профилирования памяти: поиск утечек и оптимизация. 6 окон редактора, отслеживание в реальном времени, автоисправление, 14+ типов утечек, лимиты по платформам, экспорт в PDF/HTML/CSV. Ноль зависимостей.
Описание товара
Memory Profiler Companion — это полный набор инструментов для профилирования и оптимизации памяти для Unity. Он выходит за рамки встроенного профилировщика Unity, предоставляя практические рекомендации, автоматическое
обнаружение утечек, анализ текстур, отслеживание выделений и
мониторинг лимитов, зависящих от платформы — всё из отдельных
окон редактора.
6 ОКОН РЕДАКТОРА
Memory Dashboard — центральный раздел с обзором в реальном времени,
разбивкой по категориям, топом ассетов, рекомендациями с AI и историей снимков. Сделайте снимок, сравните и экспортируйте данные памяти
в один клик.
Texture Gallery — визуальный браузер для всех загруженных текстур.
Виды: сетка, список и подробности. Фильтруйте по проблемам: без сжатия,
слишком большие, не соответствующие POT, читаемые, без mipmaps. Сортируйте по размеру, имени,
разрешению или формату.
Leak Detective — автоматический сканер утечек памяти, обнаруживающий 14+
типов утечек: статические ссылки, подписки на события,
делегаты, корутины, дублированные ассеты, паттерны роста памяти.
Непрерывный режим мониторинга для Play Mode.
Allocation Timeline — диаграмма выделений в реальном времени
по кадрам с увеличением и прокруткой. Рейтинг горячих точек показывает самые тяжёлые
аллокаторы. История событий GC с информацией о генерации и освобождённой памяти
в деталях.
Reference Explorer — прослеживайте, что удерживает объекты в живых. Просматривайте
полные цепочки ссылок, выявляйте корневые ссылки и статические
поля, мешающие сборке мусора.
Budget Monitor — лимиты памяти по платформам (Mobile
Low/Mid/High, Switch, PS4, PS5). Прогресс по категориям в виде
полос, отслеживание нарушений и сравнение между платформами.
КЛЮЧЕВЫЕ ВОЗМОЖНОСТИ
Auto-Fix Engine — оптимизация текстур в один клик (сжатие,
отключить читаемость, включить mipmaps) с полной поддержкой Undo
Smart Recommendations — рекомендации с приоритетами и
оценкой экономии памяти
Snapshot Comparison — сравните любые два снимка, чтобы точно увидеть
что изменилось
GC Monitor — давление GC в реальном времени, прогноз и
отслеживание скорости выделений
Custom Budgets — создавайте и сохраняйте свои собственные профили лимитов по платформам
Export — отчёты HTML, CSV, JSON, Markdown и PDF
Runtime API — используйте программно для автоматического профилирования в
CI/CD пайплайнах
Интерактивная демонстрационная сцена — изучайте набор инструментов с намеренно
проблемными ассетами
RUNTIME API
Полный C# API для программного доступа: делать снимки, отслеживать
выделения, выявлять утечки, анализировать текстуры, мониторить
давление GC и генерировать рекомендации из кода. Работает и в
редакторе, и в сборках для разработки.
ZERO DEPENDENCIES
Работает сразу из коробки. Никаких внешних пакетов не требуется. Поддерживает
Unity 2021.3 LTS и более поздние версии.
Ассеты и плагины Unity
Memory Profiler Companion
Расширенный набор инструментов для профилирования памяти: поиск утечек и оптимизация. 6 окон редактора, отслеживание в реальном времени, автоисправление, 14+ типов утечек, лимиты по платформам, экспорт в PDF/HTML/CSV. Ноль зависимостей.
Теги
Частые вопросы
Доступ открывается сразу?
Да. Это цифровой товар — скачать его можно сразу после оплаты, прямо из своей библиотеки.
Можно ли использовать в коммерческих проектах?
Покупка включает стандартную лицензию для личного и коммерческого использования. Возможные ограничения смотрите в описании товара.
Какие условия возврата?
Действует гарантия возврата денег в течение 30 дн. Если что-то не так, запросите возврат в своём заказе — продавец его рассмотрит.
Какие форматы и размеры файлов я получу?
Вы скачаете файлы в том виде, в каком их подготовил продавец (около 1.42 MB). Форматы указаны в характеристиках и описании товара.
Обновления бесплатны?
Да — когда продавец выпускает новую версию, вы можете бесплатно скачать актуальные файлы из своей библиотеки. Последние изменения смотрите в истории версий.
Цена
$21.99